

Complexity and Scale in the Environment
Whenever we are looking at the environment there are multiple scales on which we can approach our surroundings. We can look from a satellite for example and see the effect of topology on hydrological processes, or we can look with a microscope at the different microbes that are present at the root surface of a plant to study the effect on nutrient uptake. It is therefore important to know the goal of the observations before an environmental analysis is performed or before the environment is changed by human interference. Now, when we are looking at turf, sports, agriculture and the public domain, we are generally interested in the health and quality of the crops/plants that are present in our environment. But then questions arise like: “How do we achieve the highest possible quality?”, “How can we prevent disease?”, “How can we deal with drought?”, etc.
To awnser these questions we have created a simple overview based on literature and research, that aims to explain the different factors and scales that explain the relation between the apparent quality and the environment. This overview is called “The Lumbricus Hierarchy Concept” or LHC (figure 1). The most important term in this name is “hierarchy”, for a hierarchy in this instance implies that there is a top down approach in scale. If we take a statistical approach we could say that the top layer (Soil and Climate) explains roughly 90% of the variation that we see in the environment, the second layer (Nutrients and Water) explains about 8% and the third (Spatial Heterogeneity) explains ca. 2%. Even though these numbers are somewhat arbitrary and can differ from site to site, they do give a sense of importance in relation to the scales. For example, there is no use in trying to solve a problem with disease by looking at the third layer, when the soil texture (first layer) is the problem. Furthermore, it is not necessarily the case that one layer is more important than the other, but this schema visualises the order in which the problems should be approached. To explain this concept further, we will briefly go over the different levels of the hierarchy in this article.
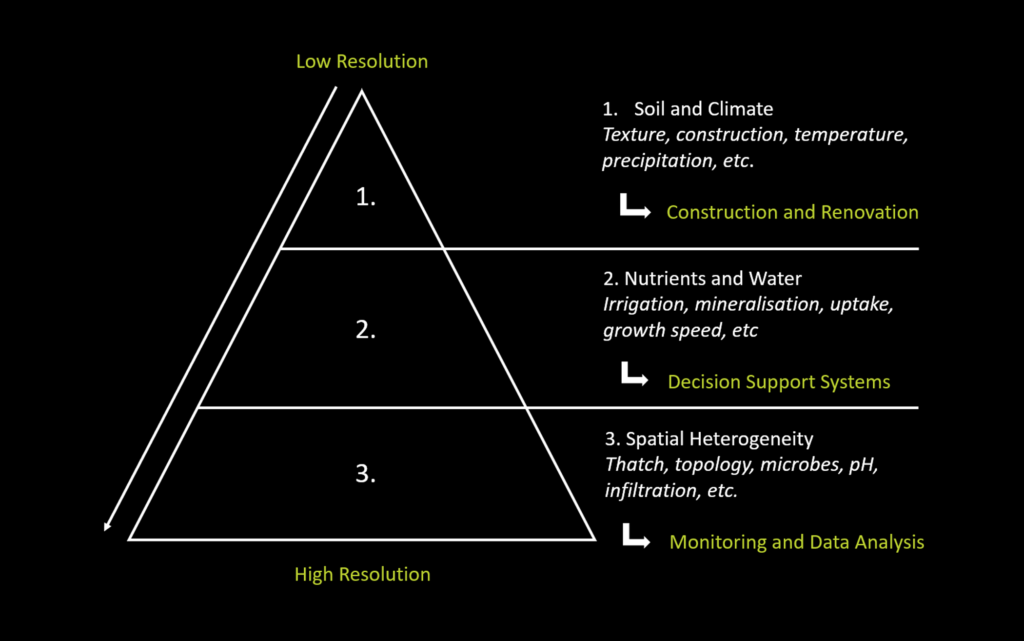
Figure 1: The Lumbricus Hierarchy Concept
1. Soil and Climate
In general, biological processes like plant growth and disease developments are largely effected by abiotic factors like the texture of the soil, the temperature, precipitation, etc. These are factors that are mostly given to us and are either hard to change (soil), or impossible to change (climate). My favourite example to demonstrate this principle is that of heather vegetation. There are two main types of heather: common heather (Calluna vulgaris) and bell heather (Erica cinerea). Now, the most common mistake that is made is that we believe that we can determine what grows where, but in reality, it is exactly the other way around. The environment determines what can, and what cannot grow at a specific site. So, when we look at heather we can distinguish two major differences i.e. dry and wet. Lets say we go to the Veluwe in the Netherlands. The Veluwe is geologically one of the more interesting places in the Netherlands becouse of its complex origins. And what is specifically interesting to our example here is the topology of the area. Generally we expect that locations at higher elevations are dry, and depressions in the landscape are wet. However, that is not necessarily the case. There are locations at ca. 100 meters height that consists of finer sand with a low nutrient availability. Now what is interesting, is that becouse of the texture and a high average precipitation, there is a artificial groundwater table that results in a wetland at these higher altitudes. On the other hand, at the lower altitudes the soil mainly consists of course sand that originates from river sediments. Thus we have wetlands at higher altitudes and dry barren lands at lower altitudes. What we can hence observe, is that our Bell heather is located at these wetlands and our Common heather is located in these dryer regions.

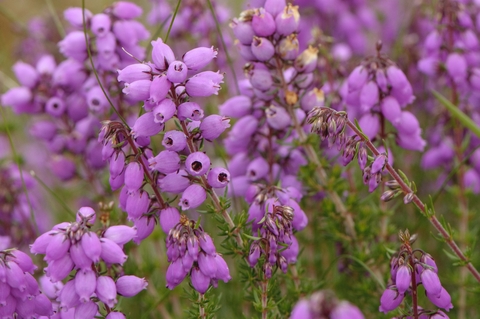
Figure 2: Left, Common Heather. Right, Bell Heather
However, there were initiatives to create new areas in the Netherlands with heather vegetation to restore the previous ecosystem. But as we can see from our example, these plants have very specific requirements for where they want to grow. So when we do not take into account these requirements, we can make big costly mistakes like in a specific part of the Netherlands where I studied the results of man made nature. In this area that had a former land use consisting of agricultural land, the goal was to create new Common heather vegetation since this was supposedly the land use before it was cultivated by humans. So what they did was, they excavated parts of the land to get rid of the nutrients in the topsoil. What they did not foresee however is that they had created depressions in the landscape where during higher intensities of precipitation, nutrients and water would accumulate. Hence, they created wet and nutrient rich depressions, and after 3 years there was still hardly any heather at these sites.
What we should note from this example, is that whenever we look at the environment, what we see is merely the result of the soil and the climate. And whenever we look at sports, turf, agriculture and the public domain, we are for a large part restricted by these factors. We can use chemicals like bio-stimulants to improve the microbe activity in the soil for example, but if the texture is wrong or there is a drought, these products will not work. Or, if we want to have a new practise to reduce disease without pesticides, but our greens are always too wet becouse of the fine texture, then this will never be possible.
Now, even though we cannot control the climate, we can, to an extend, change the soil and geology to accommodate our wishes. By way of analysing the hydrology, topology and geology of a specific area, Lumbricus helps with complete planning of construction and renovations. So, for example, even though there are golf courses on a clayey soil, this does not necessarily mean that they have to be unplayable during longer periods of rain. However, only, and I mean only, when the soil and geology are optimised can we go one level deeper in our hierarchy.
2. Nutrients and Water
We now go to our second level, which is the level of nutrients and water. And even though we know a lot about these factors in theory and through our immediate observations in our experience, it is still very hard to know what exactly a plant needs at every moment. However, if we get it wrong, for example when we give too much water and to little nutrients, even when it is only 2 mm and 1 kg/ha, then we are susceptible to disease, drought and weeds. But now the question is: “how do we know what our plant needs exactly?”.
This is precicely the question that Decision Support Systems (DSS) aim to solve (click here to see our product ControllTurf). By taking into account a multitude of different environmental factors, it becomes possible not only to know what the plant needs at this particular moment, but also what it will need 3 or 4 days from now. Behind these decisions are complex models that produce a variety of complex outputs. Now the key is to translate this data to a simple overview so the user is able to know what should be done.
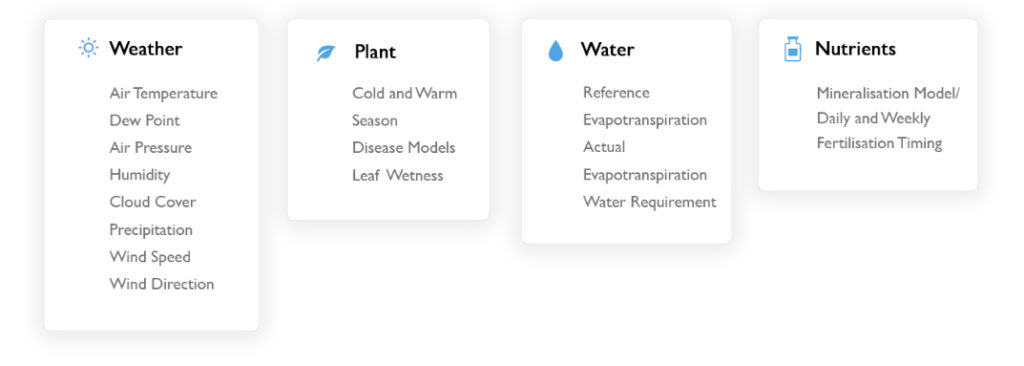
Figure 3: Environmental factors used in ControllTurf.
For example, a lot of data is being gathered nowadays. A weather station is able to tell us what the weather was yesterday and today, and with some advanced systems it might even tell us what the evapotranspiration (ET) is today, even though this is the reference ET and not the actual ET. We have a graph for the amount of rain, the temperature, the windspeed, etc. But how much water should we now actually use? The same goes for nutrients. Say we take a soil sample and measure the amount of mineral nitrogen in the soil. This tells us what it is today, but it does not tell us what the plant needs. And when we see that the plant needed it, we are to late.
What is important to note here, is that it is no use to go and look at the spatial heterogeneity when these basic needs of the plant are not met. As a consultancy company we often get the question why the front of a green has got disease, but the back doesn’t. This question is impossible to awnser though, when the water and nutrient status of the total green is not optimal. For when we perform a statistical analysis, the variation that is explained by the difference in the front and the back of the green is relatively small compared to the effect of the water and nutrient problem that preceded the disease. Only when we optimise our nutrients and water can we go one level deeper.
3. Spatial Heterogeneity
We have now reached the deepest and most complex level of our hierarchy. Here we see the largest number of variables that exist within our environment, together with the greatest challenges of quantifying these factors. However, this makes it also one of the most interesting levels for researchers and consultants like ourselves. If we now have a (near) perfect construction and we have managed to optimize our nutrient and water management, it could still be that there are problems with our plants or soil. This then warrants deeper investigation into the processes that govern these processes. This could be research into the relation between the plant roots, its exudates and the environment, or it could be research to the development of thatch and mat in the soil which has proven to be one of the main factors that effect disease and drought. That is, among others, the reason that Maurice Evers wrote a scientific article about thatch and mat development in turf soils, published by the Agronomy Journal (Evers, et al. 2020).
Furthermore, with the rise of technology it is increasingly becoming easier to measure and to process the environmental data needed to analyse this layer. For example, with the help of GIS tools we can now not only create nice pictures that show the spatial variability, but we can also use this data for statistical analysis to see which factors effect these spatial patterns. When we measure moisture, thatch thickness and the slope of a green, we can for example find a significant relation between the water content and the thatch thickness, where increasing thickness results in increased moisture content. We already know that excess moisture results in disease and hence thatch control should be on top of the list at such a green.
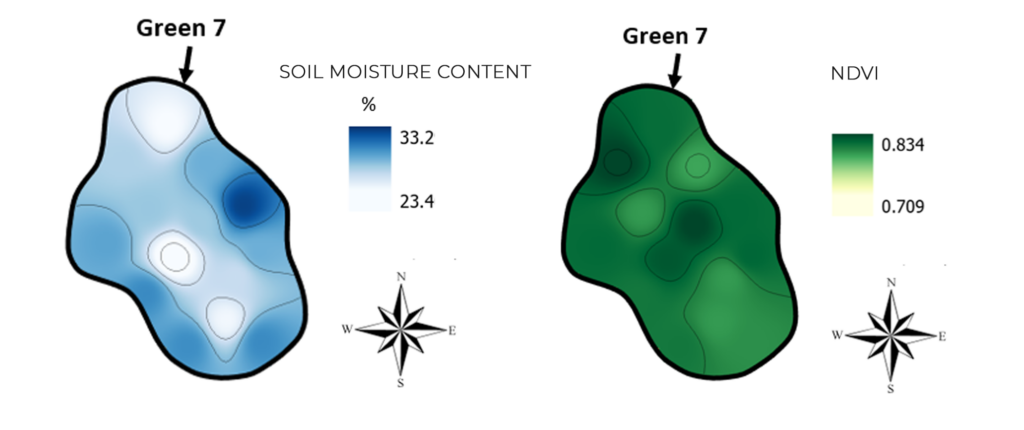
Figure 4: Example of spatial heterogeneity in greens (picture from the Lumbricus Golf Quality Monitoring (GQM))
This is only one of many examples, but it clearly demonstrates the need for research into these factors. This theory will thus help to point us in the direction that we need to look and avoid looking at the problems from the wrong level of analysis. Whenever we keep this theory in mind, it will allow us to not only reduce the cost of research, but also to finally get to the answers to the questions that everybody wants the answers to.